 Melbourne · Available immediately
I turn operational friction into clear, buildable change.
Business analyst. I map how work actually runs, find where it breaks, and write the requirements that get the fix built, tested and adopted.
English and Mandarin · Full Australian work rights
CareerFrom communication to systems.
 2017–2022Independent practiceFive years of my own clients — freelance English tutoring and design in Taipei.
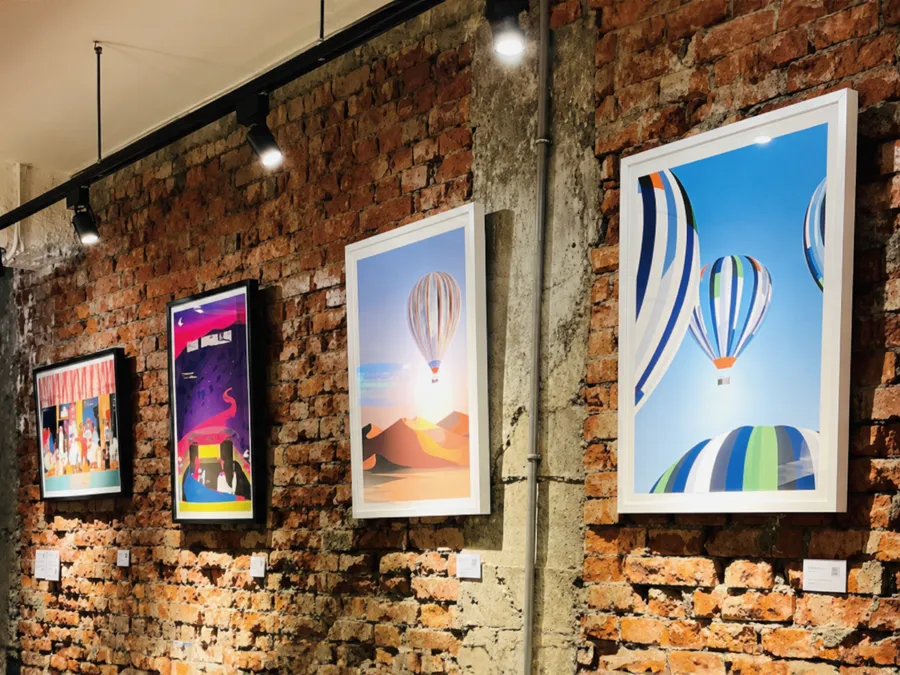 2022From projects to operationsTHE STUDIO, Taipei. Ran exhibitions end to end and built the gallery's first e-commerce channel.View case →
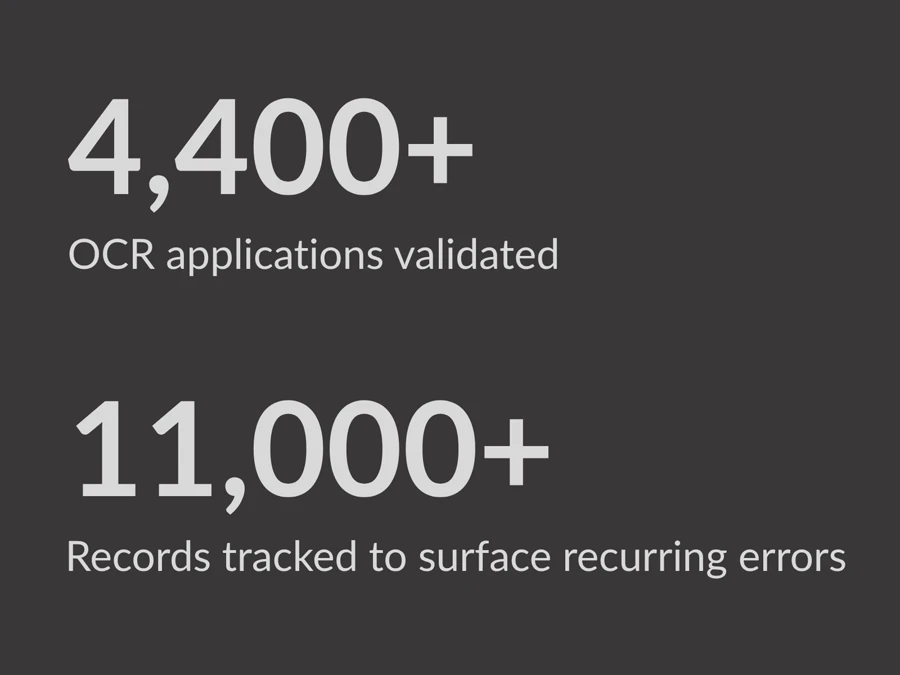 2023Into dataAIFIAN, Taipei. Field-level validation of OCR-captured applications, and an error tracker that made recurring problems visible.View case →
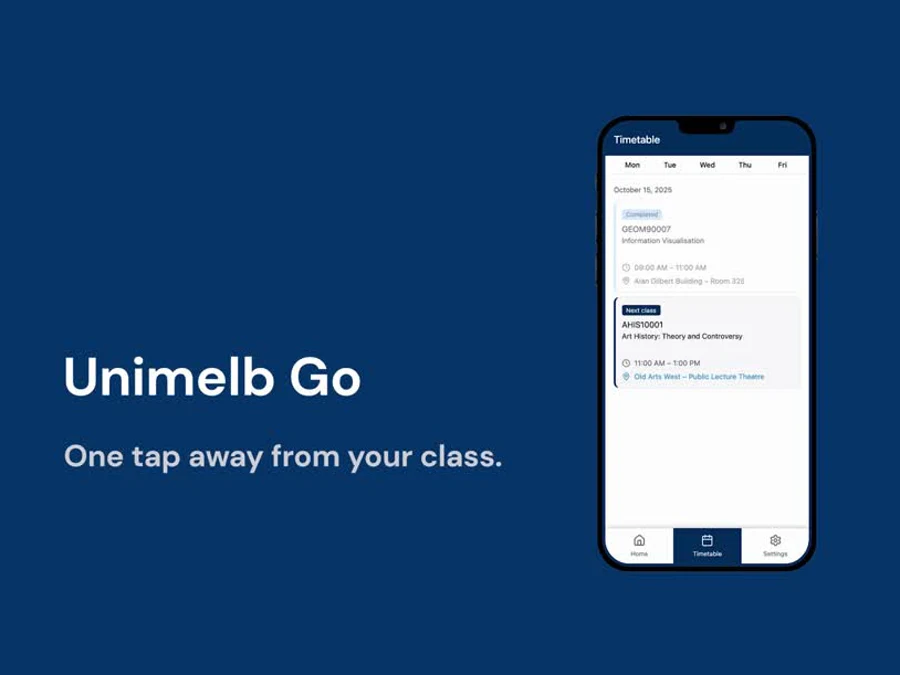 2024MelbourneMoved for a Master of Information Systems — field research, journey mapping and requirements on campus projects.View case →
- 2025Business analysisQuartile 5. Journeys, requirements and specifications — the role & access and onboarding work shipped.View case →
Based in Melbourne since 2024. Full Australian work rights to May 2028.
- 01
Mapped an onboarding journey end to end and turned it into 50+ testable specifications.
- 02
Turned operational knowledge into repeatable exhibition and fulfilment workflows, then launched a new e-commerce channel in four weeks.
- 03
Drew the first complete as-is map across three organisations; only 9.73% of elapsed time was value-adding.
Onboarding redesign for a compliance platform
The material existed. The process did not.
SSituation
What a new account actually had
Tutorial videos sat outside the product in no particular order, and the users were there because their job required it — not because they chose the software.
TTask
AAction
Three kinds of not knowing, in the first hour
A checklist that sequences the essential tasks in the order the audit cycle runs.
A tooltip on the control, carrying a short GIF of what the click actually does.
An in-product assistant that answers short, then links to the article it came from.
After — the path a new account now follows
Inside the checklist
Why this order. The checklist follows the platform’s own audit cycle — plan, do, check, act — so the first thing a new account finishes is also the loop it will run every week.
RResult
My Product Lead estimated the knowledge base could address 90%+ of common early-stage enquiries.
An estimate, not an instrumented measurement.
What I would measure next. No instrumentation existed at the time. The first three I would instrument: time to a completed first audit, checklist completion rate, and ticket volume on the top three friction points.
✓Evidence
Underneath every step. The three layers sit on one help centre: 19 articles on a single template. The assistant retrieves the right one instead of making people search, and links back to it so they can check.
Professional work, with shared delivery. I produced the journey maps, workflow proposals, Jira requirements and help-centre content; prioritisation was agreed with the Product Lead, UX and QA. Screens are cropped or reconstructed under confidentiality — happy to walk through the originals in an interview.
Three business lines, modelled as separate processes
Fine dining, an exhibition programme and an art print line in one building — and none of it written down.
SSituation
One company, three business lines
In-house fine dining and outside catering — a separate team; not a process I ran.
A programmed schedule for emerging artists, and venue hire on the two exhibition spaces. I ran it and modelled it.
Imported European and American prints, plus editions commissioned from Taiwanese artists. This case.
The three meet only at events — openings, dinners and workshops, designed and run together.
Who could see an EDITIONS print, before 2022
The limit was the building. And because a print had always left in the buyer’s hands, going online meant building both a channel and a way to despatch.
TTask
AAction
I interviewed the departing coordinator, the framer, install crews and couriers — questions written down first, asked once.
Exhibition-to-launch and order-to-fulfilment in BPMN 2.0. Fine dining appears only as a lane the opening depends on.
Every sale, in the room or online, becomes one Shopify order; the gallery’s master record is updated by hand and checked against stock counts.
EDITIONS: what the customer saw, and what held it up
The showroom, or an event that brought someone into the building — and from 2022, the online store
Imported editions and artist commissions; online marketing once the store was live
Bilingual catalogue, 106 listings
Product data standards, pricing tiers
Checkout online, or bought on the spot
Shopify updates itself; the legacy master by hand
Nothing the customer sees
Packed same day, to a standard that did not exist before
Courier delivery or gallery collection
Courier booked from NT$280, or held for pick-up
Above the dashed line is what the customer saw. Below it is the work that made it possible — the line of visibility.
Exhibition EOI confirmed → Exhibition launched
- Contractsigned, dates agreed
- 2 months outinstall crew booked
- 1 month outfinal exhibit list confirmed
- 1 week outmaterials printed
- 2 days outinstallation finished
- Opening nightfood, party, doors open
Built backwards from opening night, the one date that could not move. Minimum lead time: three months — the point past which the schedule stops being recoverable.
RResult
After I left, my successor ran the year’s pre-booked exhibitions from the process documentation.
The online store closed the following year. The gallery’s master record — the one I chose not to move into Shopify, noted on the model as “a deliberate choice while e-commerce was in trial” — carried on.
Where it stops. The routine lived in one person’s head. Nobody else could sell a print without being taught it, and no document said what it was for. At a few sales a week that is fine; at volume it is a queue at the table while someone types an order into a phone. The version that scales lets the till in the room write to the same stock as the online store, and that costs money.
✓Evidence
Paid role. The BPMN models were reconstructed in Camunda Modeler after I left, from the processes I ran and documented.
Additional experience
Data quality work that supports my analysis practice.
Data Reviewer · AIFIAN, Taipei · Sep–Dec 2023
Data quality at volume
Validated OCR-captured applications against source records, and extended the team's error-rate tracker so recurring issues became visible rather than repeatedly re-found.
Applied university projects
Four projects from my Master of Information Systems. Each says plainly what I did and what the team did.
Measuring a 61-step kitting process end to end
The waiting turned out to be between the companies, not inside any of them.
SSituation
Where a kit’s time went
A kit is every part, tool and instruction a technician needs for one job, due at the lane 30–90 minutes before it starts. One missing standard part holds the whole cart — 20% of kits arrived incomplete and took another ten hours.
TTask
AAction
Built the as-is and to-be models in Apromore, and ran flow analysis across all 61 steps.
Followed the 50-hour wait through six whys to two BOM records that nothing synchronises.
Scored three redesigns on PICK. Risk-based review goes first because it needs nothing built; the BOM fix follows.
Root cause, in six questions
- Why 1Why does a kit take 50 hours to reach the floor?The logistics provider holds the cart until every listed part has arrived.
- Why 2Why is there a long wait for parts?Constant part shortages, standard parts especially.
- Why 3Why do standard parts run short?The supplier does not replenish in time.
- Why 4Why can’t the supplier replenish in time?The inventory and demand data they work from is wrong.
- Why 5Why is the data wrong?Virtual ordering shows stock as available when it is not, and BOM overwrites distort the demand signal.
- Why 6Why does that keep happening?Nothing synchronises the two BOM records, and no one owns the conversation between engineering, materials and logistics.
Stopping at the third question would have produced a supplier problem. It is not one.
RResult
All three redesigns scored high on payoff, so the order was decided on effort — sequencing, not substitution.
Every figure here is model output, derived from a published teaching case and our stated assumptions — not the manufacturer’s operational data.
✓Evidence
Where the 5,566 minutes went
Flow analysis across all 61 steps. The terracotta band is the 9.73%; everything else is the kit waiting, and most of that waiting sits between the three organisations rather than inside any one of them.
Three redesigns, scored on payoff and effort
- 2
Risk-based review routing — do first
Review and approval merged into one activity: routine changes take a single fast loop, safety-critical ones keep full scrutiny. It needs nothing built, which is why it goes first, and it attacks the review burden the analysis sized at 700 hours a month.
- 1
Automated BOM synchronisation
An API pushing each bill-of-materials update from the engineering tool into ERP, so the two records stop drifting. This is the one that addresses the root cause — and it costs the most to build, which is why it follows rather than leads.
- 3
Kit issue management at the point of use
A technician logs a missing part where they find it and the system raises the report itself. Capture the information once, at the source.
All three scored high on payoff, so the order was decided on effort. Change 2 goes first because it needs nothing built — not because it is the one that fixes the cause.
Both exhibits above are redrawn for publication. The BPMN models themselves stay unpublished: they were built on a teaching case licensed for course use, and the model carries that case’s process detail. Happy to walk through them in an interview.
Team project of three. The models, flow analysis, Five Whys and PICK scoring behind this page were my part. Proposals were assessed, not implemented. The company is not named because the teaching case the work is built on is licensed for course use.
Designing for a decision that has to withstand scrutiny.
Admissions was under public and legal challenge, and had to show its standards were applied consistently.
SSituation
Three readers, three different questions
Is the intake on track, and where is it coming from?
Were the stated standards applied the same way to everyone?
Can a single decision be traced back to the record it was made on?
TTask
AAction
One measure per reader, so each of the three questions has a number that answers it.
Source systems through ETL staging to a data mart and reporting layer, with a landing zone for paper applications.
Fifteen weeks in seven phases, timed around the admissions cycle, with a dashboard mock-up on simulated data.
RResult
Each group got one defined measure to look at, and a path for the data to reach them.
Designed, not implemented — a semester project. The dashboard uses simulated data.
✓Evidence
Academic team project. My part was the KPIs, the proposed architecture, the dashboard mock-up and the implementation roadmap — the three figures shown here are mine.
From field evidence to product requirements.
Students could reach the right building and still lose time finding the entrance, level and room.
SSituation
Where wayfinding breaks
In their words
“guys how am i meant to find where my classes are like wth does PAR-115-L5-516-Flexible Learning Space (30) mean 😫”
Student post · digital observation
“Google Maps only shows the building… hard to find them.”
Jia · interview
“Maybe I'm old-fashioned or something. I can take a paper map with me. I'll get familiar with the campus at the beginning.”
Participant 3 · interview
TTask
AAction
Reddit threads pointed us at Building 104 and the timetable codes before we had written a single question.
How students actually navigate, and which tools they trust.
Two tasks each, to catch the gap between what people recall and what they actually do.
Field note
Students had already built their own fix — out of a vending machine.
Building 104 is not listed on Google Maps. With only the timetable code, the building did not exist to a student's phone.
So someone added a vending machine to the map, named it “Building 104 UniMelb”, and others navigated to it.
Nobody reported this. It surfaced because we went looking at what people were already doing to get around the problem.
RResult
How the 19 is counted. 10 survey responses, 6 interviews and 3 guided observations. Each figure above counts participants across all three methods — and because the three observation participants had also been interviewed, the 19 counts some people in two methods. Indoor navigation, for example, is 6 survey · 2 interview · 2 observation.
Wayfinding breaks after Google Maps reaches the building — at the entrance, the level and the room.
19 research engagements became ranked functional and non-functional requirements. The surprise was paper: the fold-out campus map goes to prospective students on Open Day, not to enrolled students in O-Week — outside our digital brief, so we recorded it rather than pursued it.
✓Evidence
Academic team project. I wrote the methods, conclusion and next steps, co-wrote the executive summary, and contributed to the requirements analysis. Findings are team outcomes.
Modelling a rental domain as an ERD.
Properties, owners, tenants, leases, payments and maintenance, laid out as one entity relationship diagram.
SSituation
What the schema had to hold
Owners hold several properties, tenants sign several leases, and each lease carries its own payments and maintenance — relationships that go wrong quietly when the model is loose.
TTask
AAction
We worked through the business rules together before drawing anything.
I turned those decisions into entities, keys and cardinalities.
22 tables, 112 columns and 34 foreign keys in one diagram, which the team reviewed and refined together.
RResult
One complete entity relationship diagram the whole team could review and refine together.
✓Evidence
Academic team project. I led the modelling discussions and drew the complete ERD; the team reviewed the business rules and refined the structure together.
Approach
Analysis grounded in people, process and evidence.
Observe
Stakeholder interviews, guided observation, surveys, affinity diagramming and problem framing.
UniMelb Go — 19 research engagementsMap
Customer journeys, as-is and to-be BPMN, business rules, root-cause and value-added analysis.
Aerospace kitting — the first complete as-is map across three organisationsSpecify
Business requirements, user stories, acceptance and QA criteria, Jira-ready specifications and prioritisation.
Quartile 5 — 50+ testable specificationsValidate
Test scenarios, UAT and user-perspective testing, defect documentation, and checking the redesign holds up.
Quartile 5 — QA testing as a first-time userMethods
Tools
About
A systems thinker trained to communicate.
Master of Information Systems, University of Melbourne. Bachelor's in Radio and Television, National Chengchi University.
Understand the human context, find the structure beneath the problem, and communicate the next step clearly to both technical and non-technical teams.
Contact
Chi Jen (Chris) Wang
Business and process analyst in Melbourne. Available immediately. Temporary Graduate visa (subclass 485), full Australian work rights to 11 May 2028.